
Agentic AI DevOps: ML Model Selection & Metrics
Recap of the previous session
- The loan-approval model was a binary classification problem, trained on past applicants.
- Real data was cleaned first: spaces, a useless ID column, duplicates, missing values, combined asset columns, 0/1 encoding, and
logscaling of large numbers. - The data was split into
Xandy, thentrain_test_split,LogisticRegression,fit,predictandaccuracy_score, which gave about 91%.
In this session
- What makes a model accurate: the common pitfalls
- Hyperparameters and epochs
- Experimentation: changing one thing and comparing
- Choosing a different algorithm: a decision tree
- What a classification model really outputs: probabilities
- Why accuracy alone can mislead, and the confusion matrix
In one sentence: to improve a model you experiment: change the algorithm, the hyperparameters or the data, measure again, and look beyond accuracy.
1. What if 91% is not good enough?
Suppose the use case needs about 98%. What do you change? Several things influence the accuracy:
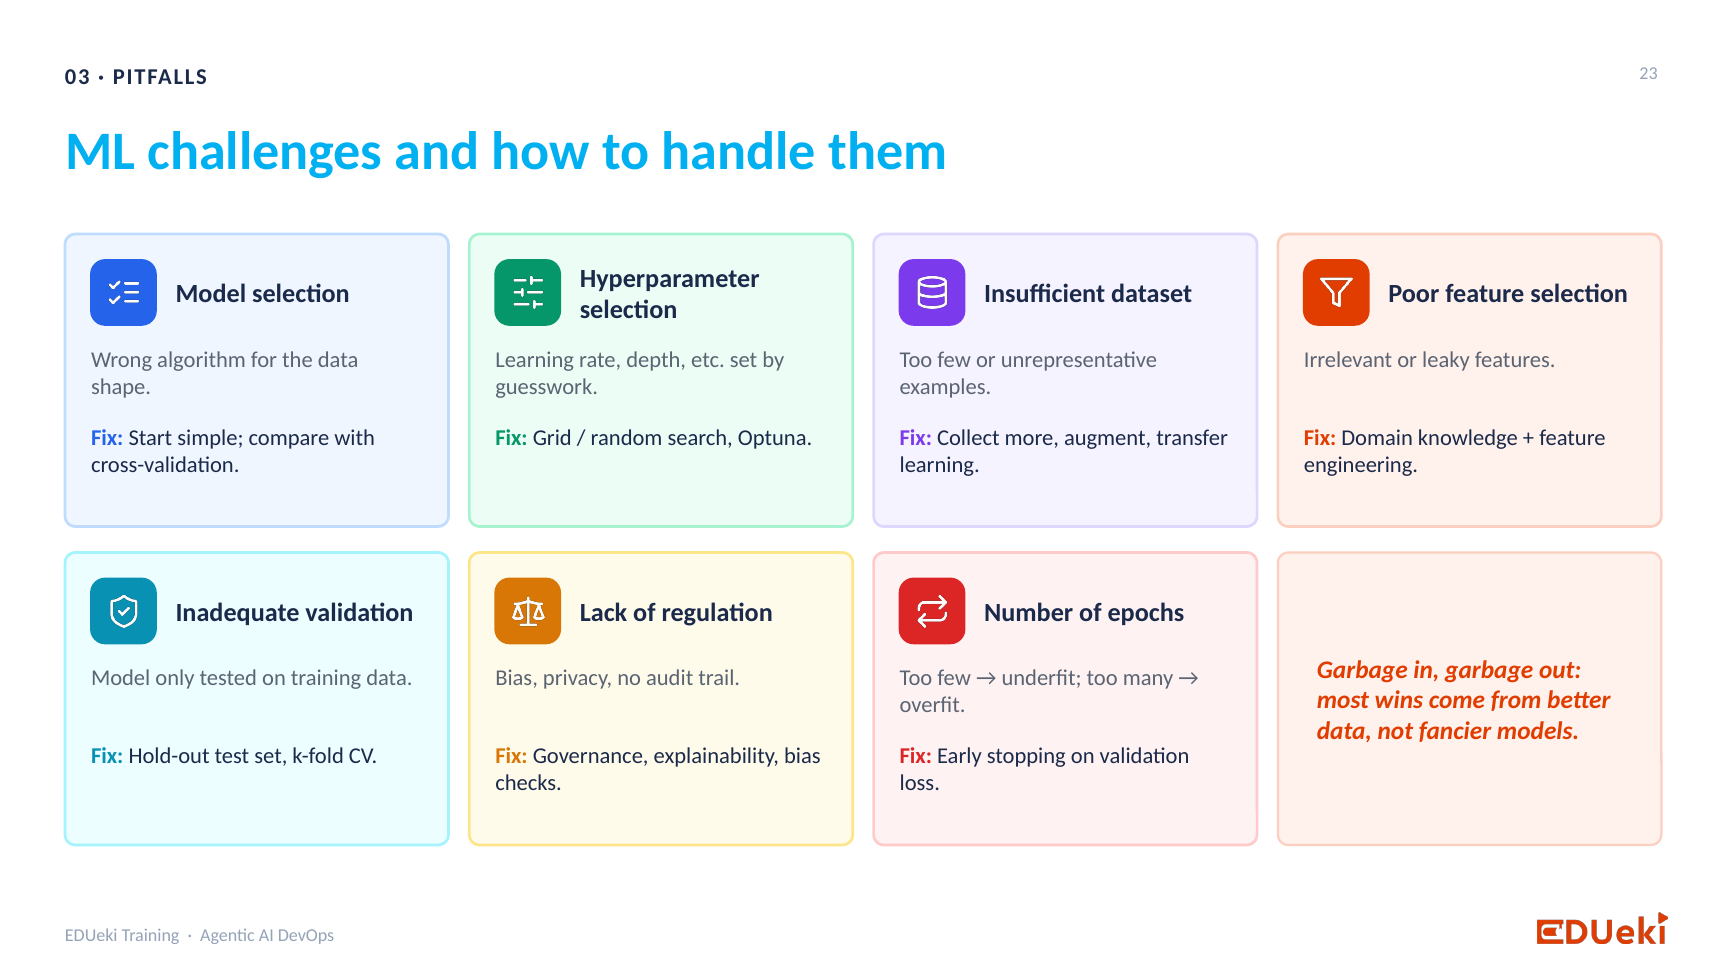
ML challenges and how to handle them
Classes should be reasonably balancedFeature selectionIs the data missing an important feature?A loan model without the credit score will be weaker.
Know which features matter for the targetNumber of epochsHow many times the model repeats the loop of calculating the loss and adjusting the parameters
| Factor | What It Means |
|---|---|
| Model Selection | Is the chosen algorithm suitable for the problem? |
| Hyperparameters | Are the algorithm’s tuning settings appropriate for the problem? |
| Enough Data | Ten records will not provide reliable accuracy. You need a sufficient number of records to train the model effectively. |
| Balanced Data | If 95 out of 100 records are approved, the model may learn to predict “approved” for everyone, resulting in poor performance on the minority class. |
In the previous sessions the number of epochs was never set, because the algorithm used its default.
2. Hyperparameters
Look at the documentation of LogisticRegression: between the brackets there are many settings such as max_iter, penalty, C and random_state. These are hyperparameters. They change how the model trains.
max_iterdefaults to 100, so training stops after 100 epochs. If that is not enough, pass your own value.- If you call the model with no arguments, it uses all the defaults. To experiment, add the parameter and value you want to try.
model = LogisticRegression(max_iter=200) # try 200 epochs instead of the default 100
You do not have to understand every parameter. In real projects the data scientists decide the model and give recommended values. You should know what hyperparameters are and why you set them, then apply the values and tune a little.
How many epochs? There is no formula. Try 100, 200, 300 and compare the accuracy. If 200 is no better than 100, try 110 or 90. The same goes for every parameter: experiment. Change one parameter at a time, because each training run costs time and compute.
3. Experimentation
“We are experimenting with the model” means: keep changing hyperparameters and the data split, and see which combination gives the best accuracy. That is why we use notebooks: you change a value, run the cell and see the result immediately.
In the session, three runs gave 91%, then 90% when the test size and random state were changed, then 92% when the test size and epochs were changed. When you are happy, you save the model.
Data quality matters as much as tuning: accurate features, no missing values, no duplicates, no imbalance. Most improvements come from better data, not fancier models.
4. Change the algorithm
Logistic regression is only one classification algorithm. Scikit-learn has many (SGD classifier, decision tree, and others), each with its own hyperparameters. Try a decision tree:
from sklearn.tree import DecisionTreeClassifier

model = DecisionTreeClassifier()
model.fit(x_train, y_train)
predictions = model.predict(x_test)
accuracy_score(y_test, predictions)       # about 0.98
The accuracy jumped from 91% to about 98%. That does not mean a decision tree is always better. For this loan dataset it is the best of the two so far. For another dataset, logistic regression might win. So you experiment with different algorithms too.
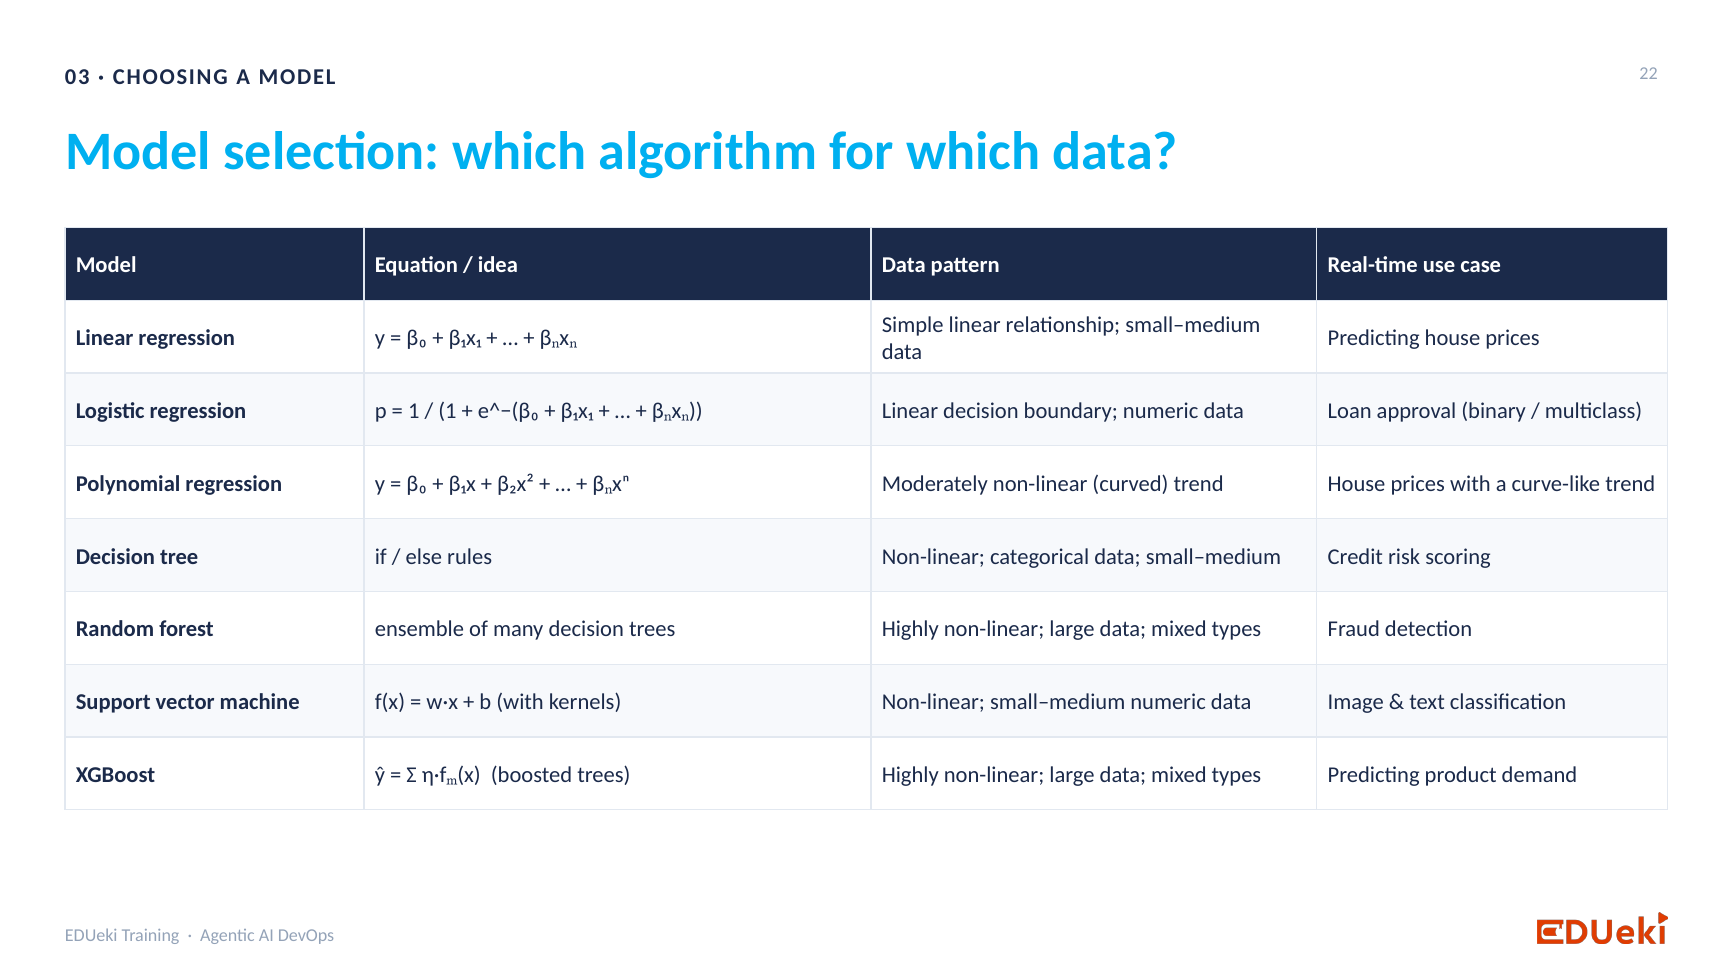
Model selection: which algorithm for which data
Each algorithm has its own equation or method for predicting. A linear regression uses m·x + b. Logistic regression adds the sigmoid. A decision tree uses if/else rules. You do not need to know the maths behind each one. The idea stays the same: the model has learnable parameters, applies them and gives a prediction. As a rough guide, linear regression suits linear data, and a decision tree suits non-linear data with categories and small or medium size data. It is only a guide, and you still experiment.
5. What does a classification model really output?
A logistic regression does not output 1 or 0 directly. It computes m·x + b, passes it through the sigmoid, which gives a number between 0 and 1, then applies the 0.5 decision boundary to give the final 1 or 0. This all happens inside predict.
To see the underlying values, use predict_proba:
model.predict_proba(x_test)[:5].round(3)
It returns the probability of each class for every applicant. When the accuracy is high, most values are very close to 0 or 1. A less accurate model gives values like 0.2 or 0.7. If a 0.5 boundary suits you, you never need to call it. (For a decision tree, predict_proba comes from the tree’s rules rather than a sigmoid, but you read it in the same way.)
6. Accuracy alone can mislead
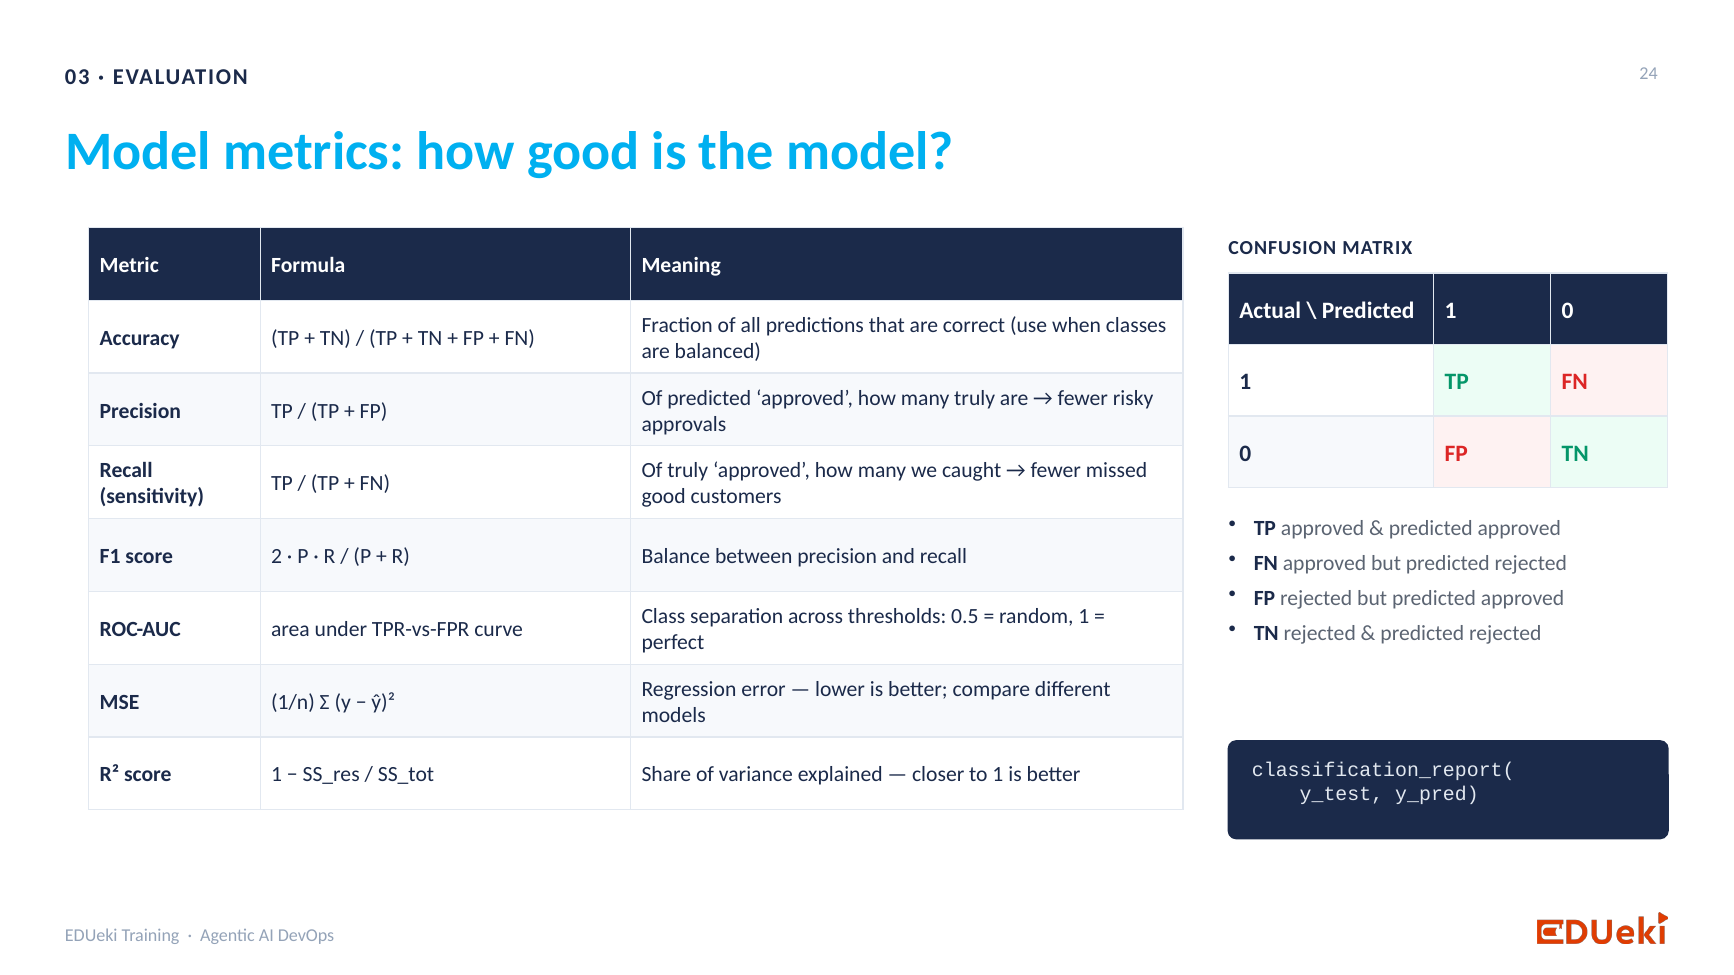 [ IMAGE: s09-model-metrics.png ]
Model metrics: accuracy, precision, recall, F1 and the confusion matrix
Suppose the test data has 100 applicants: 95 approved and 5 rejected. A model that says “approved” for everyone scores 95% accuracy, but it is useless, because it has learnt nothing.
Analogy: a student who marks “D” on every question of a multiple-choice test passes if most answers happen to be D. It does not mean they know the subject.
Other metrics help you judge a model: precision, recall, F1 score, ROC-AUC, and MSE and R² for regression. Which metric is most useful depends on the data and the problem. As an agentic DevOps engineer you only need to know they exist. The one to understand well is the confusion matrix, because people use its terms in real projects.
The confusion matrix
Take approved (1) as the “positive” class. Each prediction falls into one of four cases:
| Truth | Model Said | Classification |
|---|---|---|
| Approved | Approved | True Positive (TP) |
| Approved | Rejected | False Negative (FN) |
| Rejected | Approved | False Positive (FP) |
| Rejected | Rejected | True Negative (TN) |
from sklearn.metrics import confusion_matrix

cm = confusion_matrix(y_test, predictions)
pd.DataFrame(cm, index=["actually Rejected", "actually Approved"],
                 columns=["predicted Rejected", "predicted Approved"])
| Predicted Rejected | Predicted Approved | |
|---|---|---|
| Actually Rejected | 158 (TN) | 3 (FP) |
| Actually Approved | 4 (FN) | 262 (TP) |
Reading the result:
- 158 rejected applicants were correctly predicted as rejected, and 262 approved applicants were correctly predicted as approved.
- 3 rejected applicants were wrongly predicted as approved, and 4 approved applicants were wrongly predicted as rejected: 7 wrong out of 427.
- Accuracy is (158 + 262) / 427, about 98%, which matches the accuracy score.
7. A learner’s question: supervised vs. unsupervised learning
All the exercises so far are supervised learning: the dataset includes the answers (here, the loan status). If the training data has no answers, it is unsupervised learning. Scikit-learn supports both, but it is best known for supervised models.
8. The assignment
Compare linear regression, a decision tree and a random forest on the assignment data, and see which gives the better accuracy.
Summary
Key takeaways
- Accuracy depends on the algorithm, hyperparameters, data amount and balance, feature choice and epochs.
- Hyperparameters are set in the brackets when you create the model. The default
max_iteris 100. - Experiment: change one thing at a time and compare. Data scientists recommend, you tune.
- Switching to a decision tree raised the accuracy from about 91% to about 98%.
- A classifier outputs probabilities, then applies a 0.5 boundary.
predict_probashows them. - Accuracy can mislead. Use the confusion matrix (TP, FN, FP, TN) and other metrics.
Quick revision
| Term | Meaning |
|---|---|
| Hyperparameter | A setting that controls how the model trains (for example max_iter) |
| Experimentation | Trying parameters, data splits and algorithms, and comparing the scores |
predict_proba |
The probability of each class before the 0.5 cut-off |
| True positive / true negative | Correct predictions: approved as approved, rejected as rejected |
| False positive | Rejected applicant predicted as approved |
| False negative | Approved applicant predicted as rejected |
| Precision, recall, F1 | Other metrics that go beyond accuracy |
Remember: change one thing, measure, and keep the better model.